You are using an out of date browser. It may not display this or other websites correctly.
You should upgrade or use an alternative browser.
You should upgrade or use an alternative browser.
I’m at the dose where side effects start
- Thread starter Atlanatpr
- Start date
- Status
- Not open for further replies.
Peotidethrowaway
GLP-1 Enthusiast

It sucks. Sorry
Smiter
New member
32lbs? how long, and whats your dosage?Atlanatpr said:Honestly, it’s not that bad just stomach pain sometimes and it’s worth it considering I’ve lost 32 pounds so far I probably would’ve gained 32 pounds instead if not for this
lessthanhalf
GLP-1 Specialist

Nowhere near enough detail to give meaningful advice on dosing, but there is no law that says you cannot delay the next dose until side effects ease off or reduce the dose.

You lost 32 lbs in how short a timeframe? It may not be your stomach.Atlanatpr said:Honestly, it’s not that bad just stomach pain sometimes and it’s worth it considering I’ve lost 32 pounds so far I probably would’ve gained 32 pounds instead if not for this
Atlanatpr said:Honestly, it’s not that bad just stomach pain sometimes and it’s worth it considering I’ve lost 32 pounds so far I probably would’ve gained 32 pounds instead if not for this
Side effects usually diminish over time and are associated with dose escalation and when you first start, not delayed until later after you’ve already lost 32 pounds. The fact that you’ve lost 32 pounds suggests you’ve been on the medication for some time.
Some more details would be helpful as @lessthanhalf mentions. Things like what glp-1 you are using, the dose, how long you’ve been having this belly pain, location of the pain, etc.
lessthanhalf
GLP-1 Specialist
I did wonder whether he has a peptic ulcer or not but with no idea of what sort of pain or where in the gut it is a bit hard to start guessing.
In the studies peak gastrointestinal side effects were in the 2-4 month range after starting while doses were increasing, so it could be possible to lose 32lbs in 4 months at 1kg per month, but you would not typically see zero side effects then suddenly gut pain 4 months later as the only side effect.
In the studies peak gastrointestinal side effects were in the 2-4 month range after starting while doses were increasing, so it could be possible to lose 32lbs in 4 months at 1kg per month, but you would not typically see zero side effects then suddenly gut pain 4 months later as the only side effect.
lessthanhalf said:I did wonder whether he has a peptic ulcer or not but with no idea of what sort of pain or where in the gut it is a bit hard to start guessing.
In the studies peak gastrointestinal side effects were in the 2-4 month range after starting while doses were increasing, so it could be possible to lose 32lbs in 4 months at 1kg per month, but you would not typically see zero side effects then suddenly gut pain 4 months later as the only side effect.
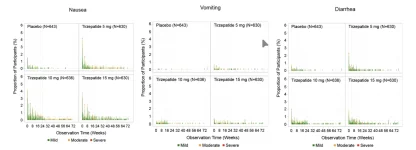
I’m not sure that “peak” gastrointestinal sides are in 2-4 month range. The largest peak on all the various symptoms (at least for tirzepatide) is when first starting. Below is from Surmount appendix.
Nausea is clearly diminishing over time as is diarrhea. Vomiting, that’s a mixed bag. I would suspect that that is driven by people that consistently have that over time. I’ve never lost my constipation side effect. But if we consider a “peak” the tallest point, that wouldn’t be 2-4 months after starting and no sides up until that point as the OP suggests. That’s clearly not supported in the data.
Attachments
lessthanhalf
GLP-1 Specialist
I was going off a graph I remember seeing in one of the studies where it showed a curve going up to a broad peak at about 2-4 months then declining, and was for nausea or vomiting. It was from a year or 2 ago so my odds of finding it again are not really that good, and would require looking through dozens of studies. At that point I was still on ozempic and not really enjoying the nausea that would not go away. The data in the graphs above look far more comprehensive and specific than my vague memory of the shape of a graph from one study, and a brief discussion in it on side effects and their timing. I am always happy to see accurate data, maybe even especially if it means I am wrong and can correct my knowledge defects. As I do not actually have to treat patients having a vague and mostly accurate memory of what I have read is usually adequate, but after looking at hundreds of papers over years there are going to be errors in my memory, and outdated data. And if looked up and provided references for every comment I made, I would be more precise, but it would take a lot of time.
I do wonder about the timing in those graphs. I found the surmount appendix and read the info under the graphs. They did start at 2.5mg and escalate doses by 2.5mg every 4 weeks. But it does not specify for sure the 15mg graph starts at the start or once that dose was reached, It does not really make sense to have the graph only start once the highest dose was achieved, but I would have though the side effects would be more spread out in time as doses went up, and maybe some peaks every 4 weeks for dose increases. For nausea and diarrhoea, but not vomiting the timing does seem to be more spread out up to 24 weeks for 10mg and not quite as clearly but for longer for 15mg. But it is still clear highest odds of side effects is after the first dose for GI effects. Which is useful information, and at odds with my statement earlier, as it suggests that early side effects might be a reasonable indicator of later side effects.
I do wonder about the timing in those graphs. I found the surmount appendix and read the info under the graphs. They did start at 2.5mg and escalate doses by 2.5mg every 4 weeks. But it does not specify for sure the 15mg graph starts at the start or once that dose was reached, It does not really make sense to have the graph only start once the highest dose was achieved, but I would have though the side effects would be more spread out in time as doses went up, and maybe some peaks every 4 weeks for dose increases. For nausea and diarrhoea, but not vomiting the timing does seem to be more spread out up to 24 weeks for 10mg and not quite as clearly but for longer for 15mg. But it is still clear highest odds of side effects is after the first dose for GI effects. Which is useful information, and at odds with my statement earlier, as it suggests that early side effects might be a reasonable indicator of later side effects.
Started Jan 22 and I’ll be moving to 10mg Monday since 8mg is working lessSmiter said:32lbs? how long, and whats your dosage?
Grogu said:Side effects usually diminish over time and are associated with dose escalation and when you first start, not delayed until later after you’ve already lost 32 pounds. The fact that you’ve lost 32 pounds suggests you’ve been on the medication for some time.
Some more details would be helpful as @lessthanhalf mentions. Things like what glp-1 you are using, the dose, how long you’ve been having this belly pain, location of the pain, etc.
Started Jan 22 and I’ll be moving to 10mg Monday since 8mg is working less. I’m on Triz and it’s not really throbbing pain or anything. I’d say it’s painful in like flashes not for long moments but it goes away too, but it’s definitely fine. It’s worth it. I started on January 22.Smiter said:32lbs? how long, and whats your dosage?
Started Jan 22 and I’ll be moving to 10mg Monday since 8mg is working less Taking trizSmiter said:32lbs? how long, and whats your dosage?
Atlanatpr said:Started Jan 22 and I’ll be moving to 10mg Monday since 8mg is working less. I’m on Triz and it’s not really throbbing pain or anything. I’d say it’s painful in like flashes not for long moments but it goes away too, but it’s definitely fine. It’s worth it. I started on January 22.
You started on Jan 22 and this is your first symptom?
Sounds like gas or someting not related to the tirzepatide. But a good idea to keep monitoring it.
It didn’t start until higher doses I didn’t get many symptoms with lower ones except throwing up once with the first dose I also get nausea but it’s rare and only for a few secondsGrogu said:You started on Jan 22 and this is your first symptom?
Sounds like gas or someting not related to the tirzepatide. But a good idea to keep monitoring it.
- Status
- Not open for further replies.